Instagram, Facebook, Twitter, Snapchat, Trade Me, Spotify, Uber, Netflix, Messenger, etc. all care about how, when, why, and for how long you use their services.
Therefore, a lot of what you do while using their service is captured and recorded.
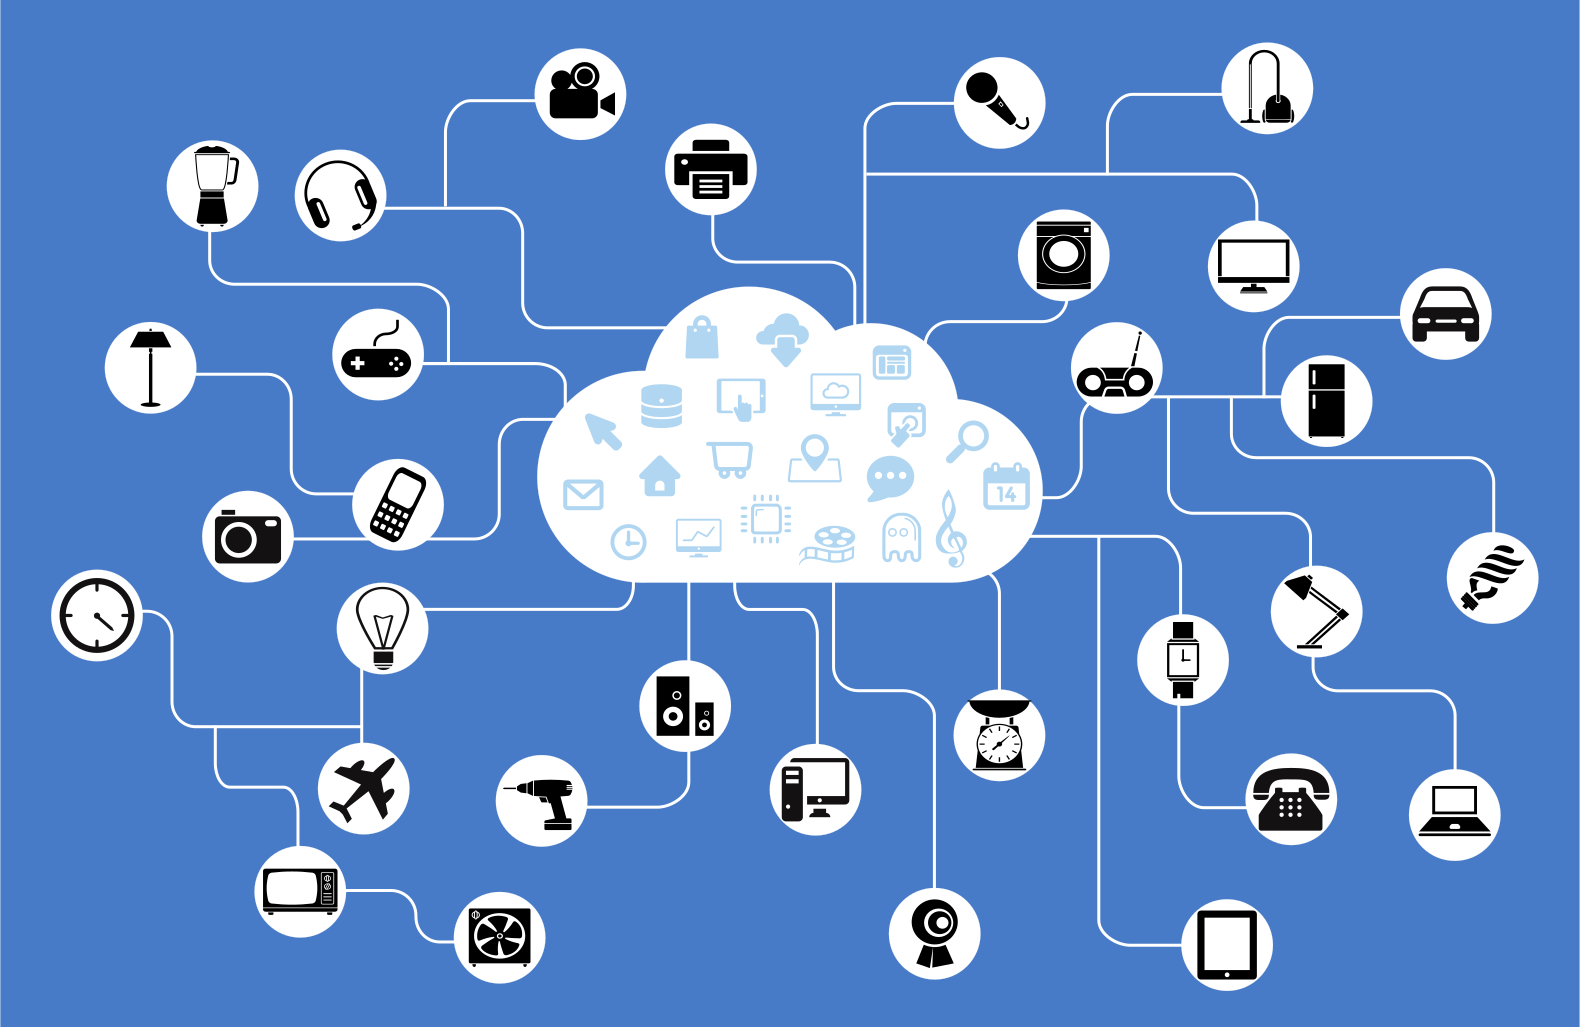
The idea of the "Internet of Things" (IoT) is to wirelessly interconnect multiple devices and objects, usually through Bluetooth or through wireless internet.
This data is often stored remotely, and referred to as being stored "in the cloud".
The Cloud
Jargon Buster
When we say data is being stored "in the cloud" it might seem to imply that all this data is stored in one magical location, or that maybe it's just floating around in the air somewhere, ready for us to access whenever we want.
It actually means something quite different (and sadly a little less magical).
When data is stored in the "cloud" it simply means it is stored somewhere other than your own computer – it is stored in a remote database that you can access over a network (typically the internet).
These databases are generally owned and managed by companies who make this storage space available to their users.
A commonly used cloud storage service is Dropbox, who provide a certain amount of storage for free, and then have users pay if they want to use more.
An important thing to realise about cloud computing is that this data is not just floating around in one big... well, cloud!
It is being stored in a physical location somewhere, and most likely across several different locations if it has been backed up.
There are a couple of different areas where IoT has really taken off:
Appliances: It’s becoming more and more popular for people to do things like turn their lights on by talking to their watch, turn their home's air conditioning on from their phone, automatically have their grocery list made by their fridge, etc.
It’s still up for debate as to whether this is really useful or not.
Healthcare: These days it is not uncommon to see people with devices on their wrist that more or less behave like a tiny smartphone, with the added feature of tracking exercise and heart rate.
Some example devices that can be connected in the IoT.
But these innovations come with a cost, and that cost is often large amounts of potentially sensitive personal information being captured, as well as security concerns around its storage and use.
The sheer amount of data these devices generate also introduces technical challenges.
Often these devices are sending real time data, which means that every minute, second, or even millisecond, some data is being captured and sent somewhere.
Estimates for the number of IoT devices that will be online in 2020 range from 30-50 billion, and that will be up to 75 billion by 2025.
That’s billions and billions of extra devices sending, receiving, and generating data over the internet, every day!
The number of people using smartphones has exploded in the last few years, to the point where in modern society it is unusual to come across someone without one.
With this comes opportunity for companies to gain more insight into how consumers spend their time, and therefore a lot of the activity on your phone is captured.
For Pixel users, Google has even released a new feature for you to see how you use your own phone.
Other personal devices that connect with your smartphone are also constantly collecting data, for example wearable tech like smartwatches or fitness trackers.
Big data is also being collected from the physical world all around us!
Sensors are devices that detect events or changes in their surrounding environment.
They capture and digitise a vast variety of data about our environment; for example temperature, sound, visual images, air pressure, physical movement, and even sub-atomic energy.
They are often relatively basic devices with limited computing power, and so they send this data to other digital devices for processing.
This is usually done over a wireless network, and some sensors may be a part of the IoT.
Environmental sensor data often is captured by proprietary systems and aggregated before being made available to the public.
Here are some examples you may be familiar with:
Ground, air, and water movement sensors are distributed across the Earth to record wind, seismic activity, and wave patterns.
This data can be used to predict and detect natural disaster events such as earthquakes, tornados, and tsunamis.
Many different types of sensors are used for healthcare monitoring.
For example, sensors are frequently used by cardiologists to continuously monitor the electrical signals in a person’s heart, so that they can record and closely examine how well the person's heart is functioning.
There are multiple sensors throughout the Large Hadron Collider that exist to capture energy readings from subatomic particles.
These generate around 25 petabytes of information yearly for physics experiments.
Some satellites continuously stream images of Earth’s atmosphere and land.
Using multiple satellites to combine images across time and location, meteorologists use this data to predict the weather.
Sensors placed in the environment or on tracking devices can be used to monitor wildlife, and are used for conservation and pest management.
The data you choose to capture, and how you capture it, has a huge effect on the outcome of your analysis.
For example, if you decide to study how often people open their fridge based on how many times a smart fridge detects it is opened and closed, then who have you excluded, and who might be overrepresented?
A smart fridge is certainly a luxury item and therefore mostly those earning more money will be contributing to your study.
Is this group representative of everyone?
This is just a silly example, but think about what happens when you are using big data to analyse medical images.
If you are analysing the effectiveness of a treatment on women and your training data only includes Pākehā (NZ European) and European women, then should you automatically apply the same conclusions to Māori women?
No, of course not, there are physiological differences between people of different ethnicities, and it would be inaccurate to generalise them into one group.
This is why it is so important to make sure that you are capturing data that accurately portrays the group of people that you want to investigate.
It’s also important to think about how data sets captured in the past, or by other people, may have been conditioned by the biases of those people.
The analysis of biased healthcare data has frequently disadvantaged groups of people in the past who were under-represented in data samples.
So now that all of this data has been collected, it needs to be stored, which is a challenge in itself.
The first issue is simply the amount of data.
As we mentioned earlier, big data often begins at terabytes, but more often than not, this expands to petabytes or even exabytes.
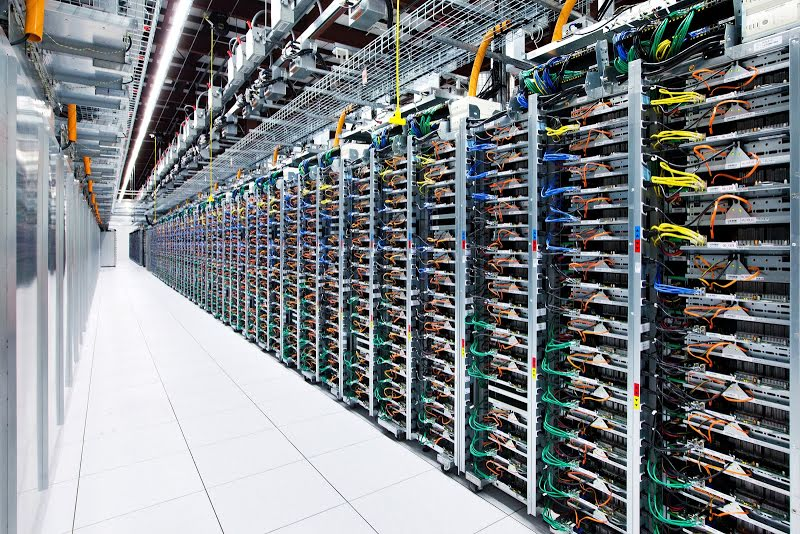
This is where data centres come in.
Data centres are warehouses (often enormous ones) containing many computers that are connected in a network.
They are used to store and process large quantities of data.
Data centres have become a popular way for organisations to solve the issue of not having enough computing power for the amount of data they collect.
Companies such as Google, Amazon, Microsoft, and Catalyst in New Zealand, offer services where other organisations can rent space in their data centres instead of having to build their own (an expensive endeavour).
Server racks in the Google data centre in Oklahoma.
These data centres store a mind-boggling amount of information.
Just think, every video uploaded to YouTube, every tweet ever written, every purchase ever made on Amazon, and every comment on every blog on the internet exists somewhere in one of these data centres (in fact it will exist in several, as there will be multiple backups of it).
A Data Centre on Punch Cards
Curiosity
In 2013, xkcd creator Randall Munroe tried to answer the question “If all digital data were stored on punch cards, how big would Google's data warehouse be?” and with some clever internet-sleuthing calculated that over a quadrillion cards would be needed.
It would be enough to cover all six states of New England in 4.5km of punch cards. And that was all the way back in 2013!
Imagine how much bigger that pile would be now!
The other issue around storing big data is the raw data itself.
There are two general categories we use to classify data: "structured" or "unstructured".
When you describe the qualities of a car, you probably list the colour, make, model, whether it is manual or automatic, etc.
We would call this data structured because there is a predetermined data model we can use to describe the qualities of the car.
For unstructured data however, there is no predetermined data model.
This is why it cannot easily be poured directly into a typical database, and therefore needs data crunching/preprocessing before it can be stored and used, which takes computing power in itself!
Some common examples of unstructured data are images in the form of a list of pixels, or recordings of human speech used for natural language processing.
Data is often preprocessed before being stored but storing the raw data, not just processed data, is very important for some applications.
Data Crunching
Jargon Buster
Data Crunching, also called preprocessing, means the process by which a large amount of raw data is prepared for automated processing.