Data analysis methods are algorithms and strategies for finding meaning from raw data.
There are many different methods for doing this, so we’re just going to take a brief look at a few that are commonly used with big data to give you a taster:
Have you ever wondered why bananas are almost always near the front of the store?
It is not just because they are nutritious and delicious, it's because they have been identified as an impulse buy so store owners want to make sure you see them.
Ever wondered why milk is not at the front of the store?
It's because a lot of people go to the supermarket to buy milk, so if the milk is put at the back of the store, you end up walking past many other items that you didn't know you wanted or needed on the way in!
Rules like these can be found in big data by using "Association Rule Learning".
The rules that have been learned here associate a retail item with a location within the store:
Bananas + front of store -> consumers buy more bananas
Milk + back of store -> consumers buy more items
Association rule learning is a type of analysis used to find relationships (or the probability of relationships existing) between variables in a large data set.
It works by defining a set of rules and gradually adding rules over time as it analyses more data, by finding frequent patterns and correlations between variables.
Large retail chains are famous for using the association rule learning technique to optimise their sales, and chances are you have been influenced by these techniques in the past.
Algorithms such as Apriori can analyse big datasets of retail transactions for frequent and important item sets and generate these association rules.
A famous example of such a retail market basket analysis is a study that discovered that between 5:00 and 7:00 p.m. customers of a convenience store often bought beer and diapers together.
Using association rule learning with data created by the millions of online transactions seen by online stores like Amazon or song playlists on Spotify, allows retailers to find important, but niche and sometimes unexpected rules.
This enables what is referred to as long tail marketing, where rather than trying to appeal to a large general group of consumers, retailers will focus on a large number of small and very specific groups and tailor their advertising specifically to them.
Rules being used for this type of marketing leads to things like advertisements for rock climbing shoes appearing on a webpage you visit because you recently purchased a helmet.
If it works too well though it can also be disturbing – how did they know I was interested in those exact shoes??
Targeted advertising, content recommendation, and market research are by far some of the most popular (and profitable) uses of big data!
Sentiment analysis is sometimes also known as "opinion mining", as it is a method for categorising the opinions expressed in text (for example in a survey, Facebook post, or Tweet).
The goal of sentiment analysis is to categorise how the writer feels about some subject.
For example, if you tweet the following:
"The Matrix was a fantastic movie!"
That tweet can easily be put into the positive category.
Where this method becomes tricky however, is if you tweet the following:
"This movie is surprising with plenty of unsettling plot twists."
We can see that is probably a positive review, but the word "unsettling" would typically be described as negative, and therefore only a clever algorithm will be able to correctly categorise this message.
Sentiment analysis on big datasets such as all news articles that reference the same event or all tweets that reference a political candidate can be used to summarise and infer overall event impacts, or general population support for a candidate.
With access to timestamps on articles and tweets, algorithms can also analyse changes in sentiment over time, which might indicate trends, such as a rising political star or emerging community issues.
This is the process of investigating structural connections between data points, where these points are connected in a network.
We call each of these individual pieces of data "nodes", and the connections between them are called "edges".
Here are two prominent examples:
Social Network Analysis:
This is used for investigating social structures using networks.
You can imagine how this works by thinking about the structure of Facebook.
You and everyone else on Facebook are each an individual node, and two people are connected by an edge if they are Facebook friends.
Together, these nodes and edges make a graph structure (a different type of graph to the ones you normally see in maths) that can be analysed.
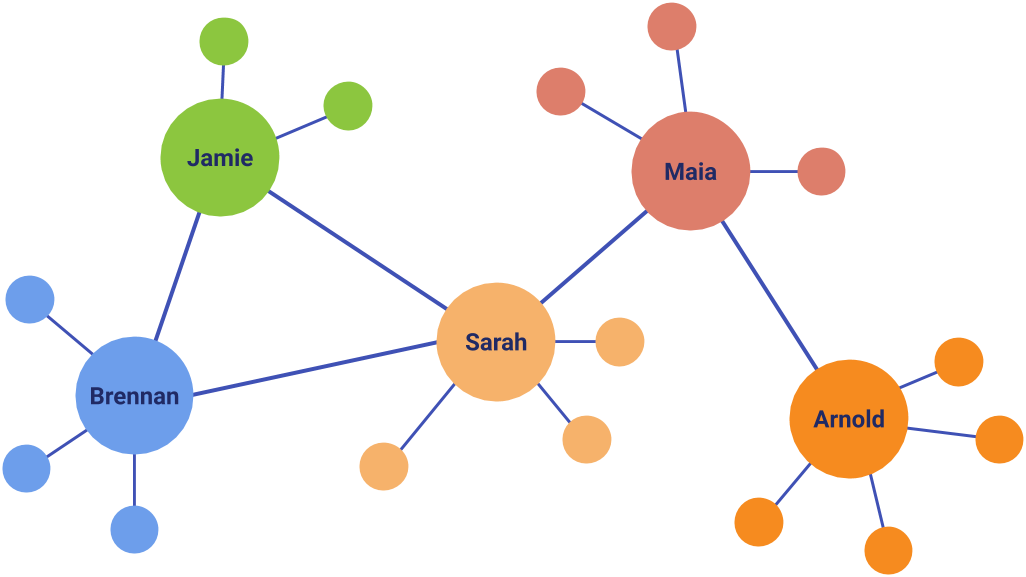
Friendships between social network users can be modelled as a network. Each circle symbolises a person, or a node, and each line symbolises a connection, or an edge.
Social network analysis is useful for understanding many things, for example: information circulation, business networks, social connections, and structures. Even how quickly a meme spreads.
Webpage Network Analysis:
One of the most famous uses of big data network analysis is the PageRank algorithm used by Google to determine which webpages to show users for given search words.
Underlying the search results is a complex ranking of more than a billion webpages.
The rank of a webpage is based on social capital and popularity contest models (and probably some other secret algorithm ingredients).
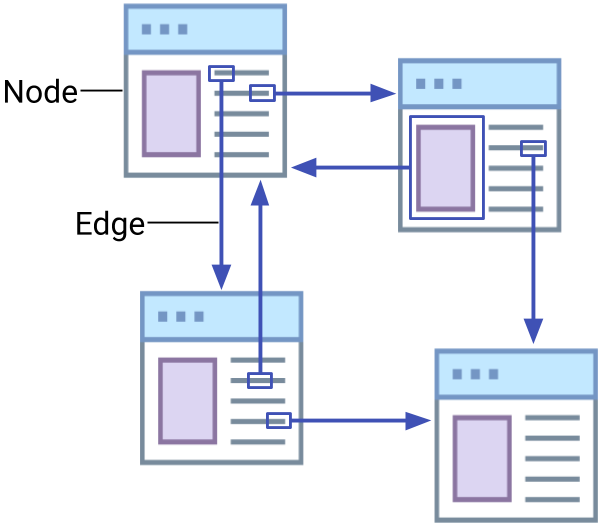
A webpage is seen as a node, and a hyperlink to another node (another website) is a directed edge.
Every incoming link to a target page gives a small amount of rank proportional to the rank of the source page.
Thus something like a YouTube video blog (or even this CS Field Guide Big Data Chapter page that you are reading!) that links a product page with Whittaker's chocolate, gives the Whittaker's chocolate page a higher ranking!
Links between webpages can be modelled as a network.
Network analysis has become an important technique in many natural science and digital humanities subject areas; including sociology, biology, communication studies, economics, history, and many more.
Analysing big data can be very time intensive and costly, and to do this efficiently often requires substantial resources.
A typical laptop computer is not powerful enough to process such a large amount of data, but luckily there are ways big data analysis can be split into smaller parts.
One of the most common ways to process big data is to use parallel computing.
Imagine you wanted to count how often a word appeared in a large document so that you could conduct sentiment analysis on it.
You could have one computer go through each word in the whole document.
But if you split the document into two parts, have two different computers count the words in each half, and then combine the results, you'll get this task done in almost half the time.
By having two (or more) computers working in parallel you can process data more efficiently.
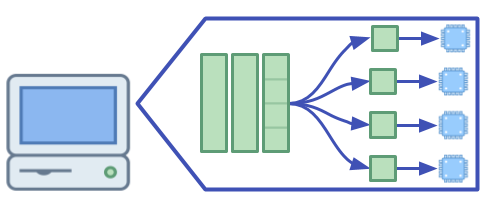
In parallel computing many computational operations are performed simultaneously by multiple processors, rather than one processor performing many sequential operations.
Techniques like multi-core computer processing, distributed computing, and clustered computing are some of the most common techniques used in parallel computing.
Each of these techniques can process large amounts of data in a much shorter amount of time than a single computer processor.
They also require any problem they are working on to be broken down, or decomposed into sets of smaller problems or processes, which can each be tackled independently and simultaneously.
Computer Scientists and Software Engineers need to come up with good methods to decompose their analysis processes, so that they can be effectively tackled with these approaches.
Multi-core, Distributed, and Clustered Computing
Jargon Buster
Multi-core Computing: in multi-core computing many calculations and computations are carried out simultaneously across multiple processors, or cores, in the same computer or CPU.
A computer breaks a task into a set of smaller tasks, each of which is completed by a separate processor at the same time.
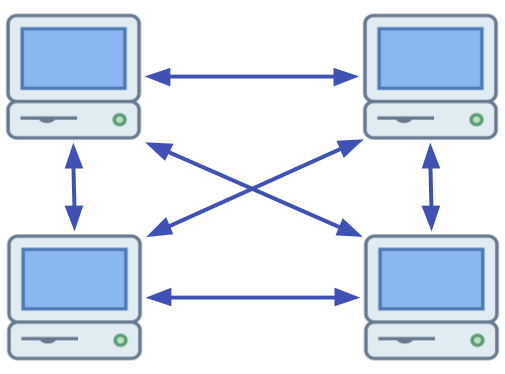
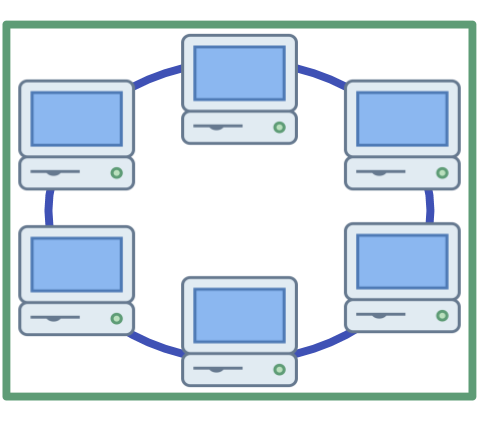
Distributed Computing: a distributed system is made up of multiple computers or servers, typically in different physical locations, connected by a network.
These computers each carry out processes and communicate with each other to solve a problem or complete a task.
Separate computers communicate with each other over a network in distributed systems.
Clustered Computing: a computer cluster is a set of connected computers or servers, typically in the same location, that work together so that they can be viewed as a single system.
Multiple computers are connected in a local network and act as one entity in a computer cluster.
Some problems are easy to decompose into independent pieces and are called embarrassingly parallel.
One example is applying the same image smoothing filter to millions of pixels in an image, each processor can apply the filter to a small section of the image and then the results can be recombined to form the new smoothed image.
Other problems, such as weather prediction simulations, are harder to decompose because one decision made during the analysis might depend on others being made.
These problems require advanced techniques such as pipelining, stochastic sampling, and replication.
Data stream analysis is about taking actions based on a series of events that have just happened, rather than collecting data and processing it later.
This approach involves creating "pipelines" that connect streams of raw data with processing systems.
This is also referred to as analysing and extracting information from data that is "in motion".
For some applications it can be crucial for data to be analysed in real time, as quickly as the data is being produced.
This is because in some situations data can very quickly lose its "value", and decisions based on this data need to be made quickly.
If these decisions are not made within a particular time frame the data may be lost, be out of date, or may no longer be of use.
For example, a website may want to fine tune their advertising as they track a user browsing their products.
Being able to analyse the users interests quickly means they can choose what advertisements to show them on the next page each time they click a link.
If this analysis takes too long however, by the time the system chooses what advertisements to use, the user may have closed the tab and left the website!
The data that was produced by their clicks has lost much of its value by this point.
A more serious example could be notifying citizens about national emergencies, such as an incoming tsunami.
If the decision to send out an emergency text message takes too long there could be dire consequences.
Data from environmental sensors is being collected constantly and data stream analytics can be hugely beneficial for monitoring and using this data.
We can also refer back to our example of EFTPOS and credit card transactions in the section on Velocity, if this data is not being analysed and processed in real time then the system will not be of use.
Decisions like whether a transaction is accepted or not can’t be happening slower than the transactions are being made, otherwise the whole system will break down!
We have explained just a few of the techniques used to analyse big data, and there are obviously many more that you may come across in further reading.
Part of what makes analysing big data so challenging is that simply picking which analysis technique to use can influence your results, and is another way for bias to influence studies.
In addition, with so much raw data available and algorithms needed to efficiently find interesting patterns in subsets of the data, it can be easy to manipulate results intentionally or unintentionally.
But doing this can sometimes result in a conclusion too specialised to one group, can remove the opportunity to find other interesting trends in the data, or can introduce algorithmic bias.
When analysing big data it is important to think about why you are using the particular analysis method you have chosen, where your data has come from, how it was collected, and how you can best use it for your specific application.